HR software is a $30 billion global industry, and the platforms every HR Director knows by name — Workday, SAP SuccessFactors, ADP Workforce Now, BambooHR, Rippling, Paylocity, Paycor — are all busy selling the same promise: a single system of record for the entire people function. But under $22 per employee per month, per G2’s 2025 benchmark, and above $50,000 a year for a 100-person mid-market deployment, those platforms price out the exact HR teams that need workforce visibility most: the 50-to-500 employee companies where the Head of HR is also the Head of People Ops, the Head of Compliance, and often the Head of Recruiting.
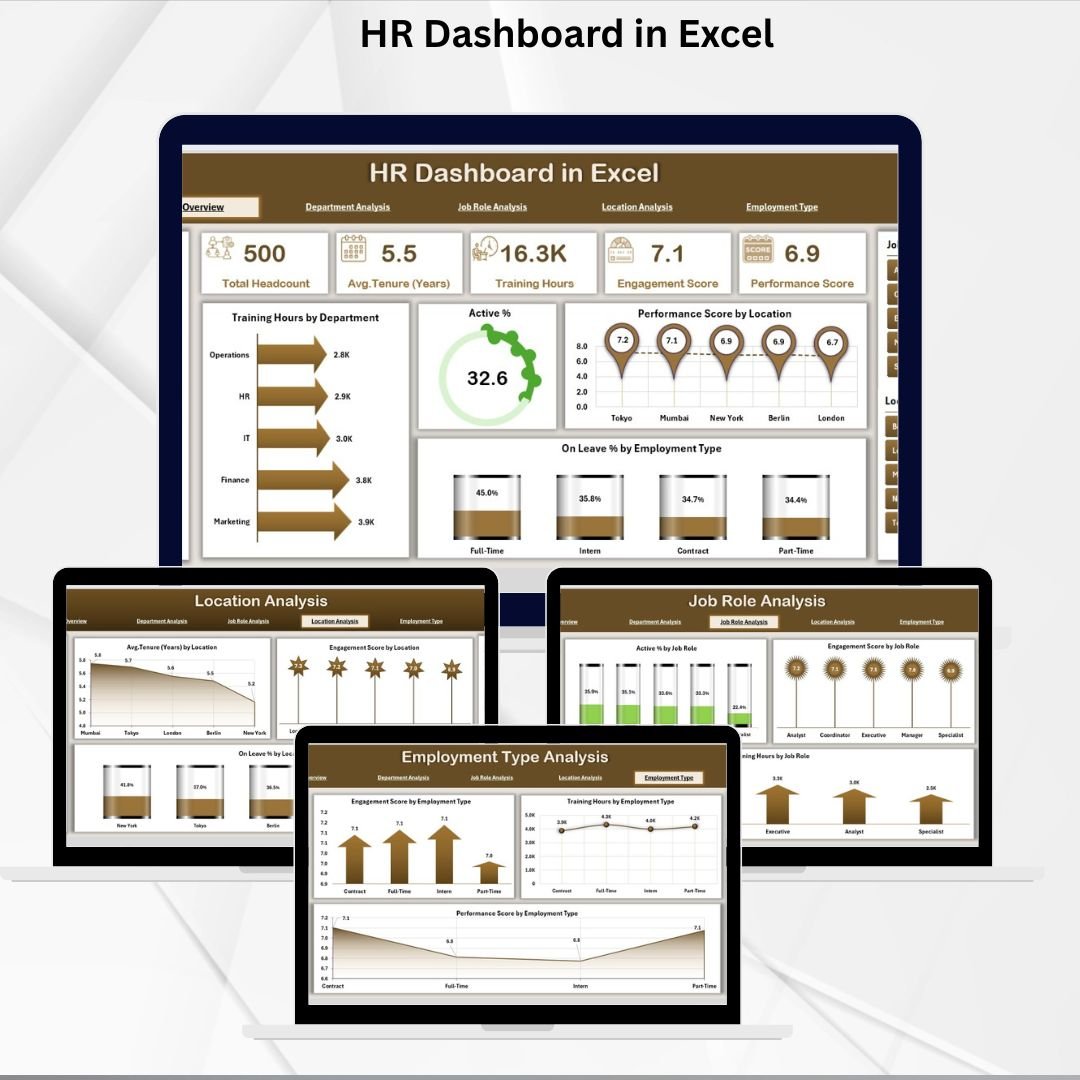
The HR Dashboard in Excel is built for that gap. It’s a ready-to-use Excel workbook with 5 analytical pages — Overview, Department, Job Role, Location, and Employment Type — covering every KPI an HR leader actually looks at weekly: training hours, performance scores, engagement, active percentage, leave percentage, and tenure. Export your employee roster from BambooHR, ADP, Workday, HiBob, or even a manual spreadsheet, paste it into the Support sheet, and the entire dashboard refreshes. Five minutes to setup, zero implementation partner, $17.99 total.
Why Mid-Market HR Teams Need a Dashboard Layer on Top of Their HRIS
- HR software averages $15-$22 per employee per month, per G2’s 2025 benchmark — which lands a 200-employee company at $36,000 to $52,800 per year for the HRIS alone.
- Workday’s first-year cost for a 1,000-employee company runs $400,000 to $1.3 million when licensing, implementation, and the dedicated project team are factored in.
- SAP SuccessFactors needs 1,000+ employees to justify the cost and complexity — implementation runs $100,000 to $500,000 for mid-market deployments and past $2 million for enterprise multi-country rollouts.
- Even BambooHR, the SMB favorite, carries a $250/month floor and charges $10-$25 per employee per month — and its built-in analytics still require manual export to Excel for the kind of cross-dimensional analysis HR Directors actually present in leadership meetings.
Here’s what every mid-market HR team eventually realizes: your HRIS is great at storing employee records, running payroll, and managing time-off requests. But when the CEO asks “which department has the highest training investment and the lowest engagement scores?”, or “what’s our tenure curve by employment type across our three offices?”, the native HRIS dashboards aren’t enough. You export to Excel anyway. This template replaces that ad-hoc export process with a structured, ready-to-use analytics layer — whether your source data is HRIS-exported, HRMS-exported, or hand-maintained in a spreadsheet.
What’s Inside — 5 Analytical Pages + Page Navigator
🧭 Page Navigator (Left Sidebar)
One-click navigation between all five analytical pages. Located on the left side of the workbook, visible from every sheet. This is the single biggest usability difference from a standard Excel analytics sheet — HR teams spend less time scrolling and more time analyzing.
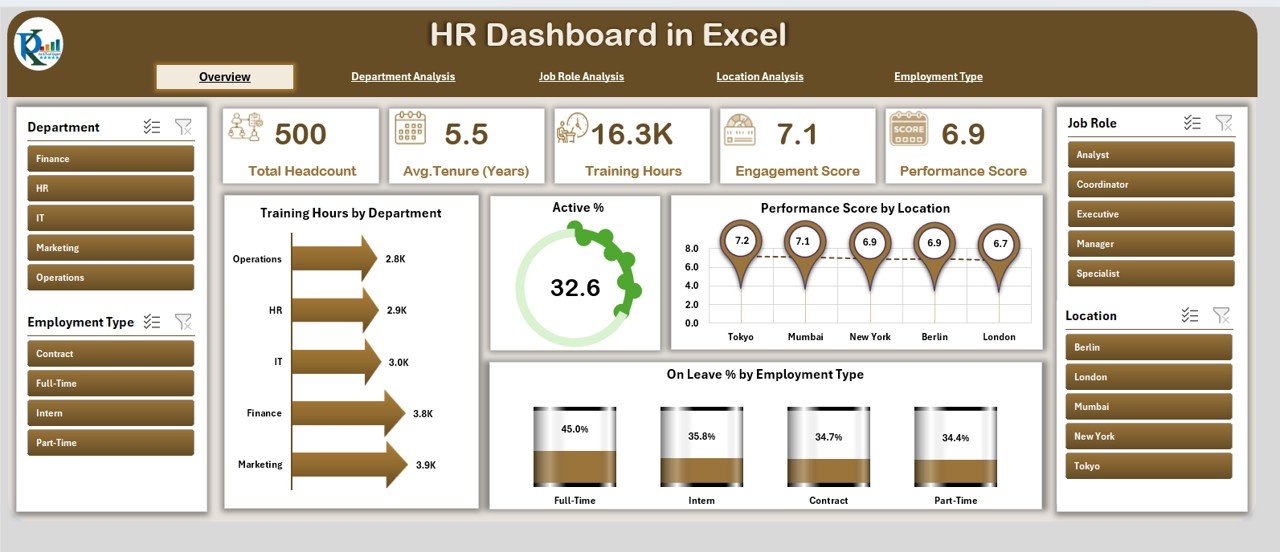
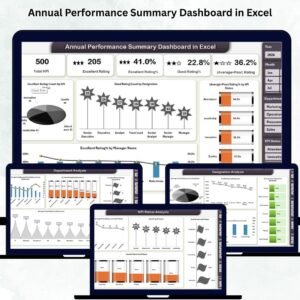
📊 Overview Page — Complete Workforce Snapshot
Displays 5 quick KPI cards and 4 headline charts: Training Hours by Department, Active Percentage of Employees, Performance Score by Location, and On-Leave Percentage by Employee Type. This is the page that opens on launch and the page that gets screenshot for board decks.
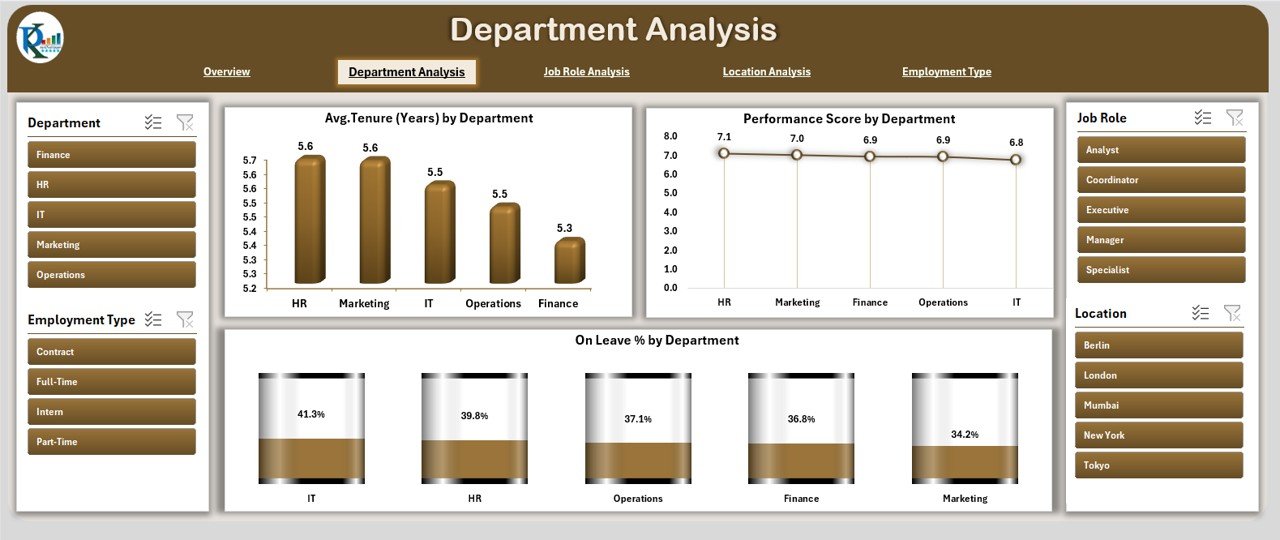
🏢 Department Analysis
Workforce trends by department. Charts include Average Tenure, Performance Score, and Leave Percentage by Department. The view that immediately surfaces whether Engineering has a tenure problem, whether Sales has a performance issue, or whether HR itself has a leave concentration.
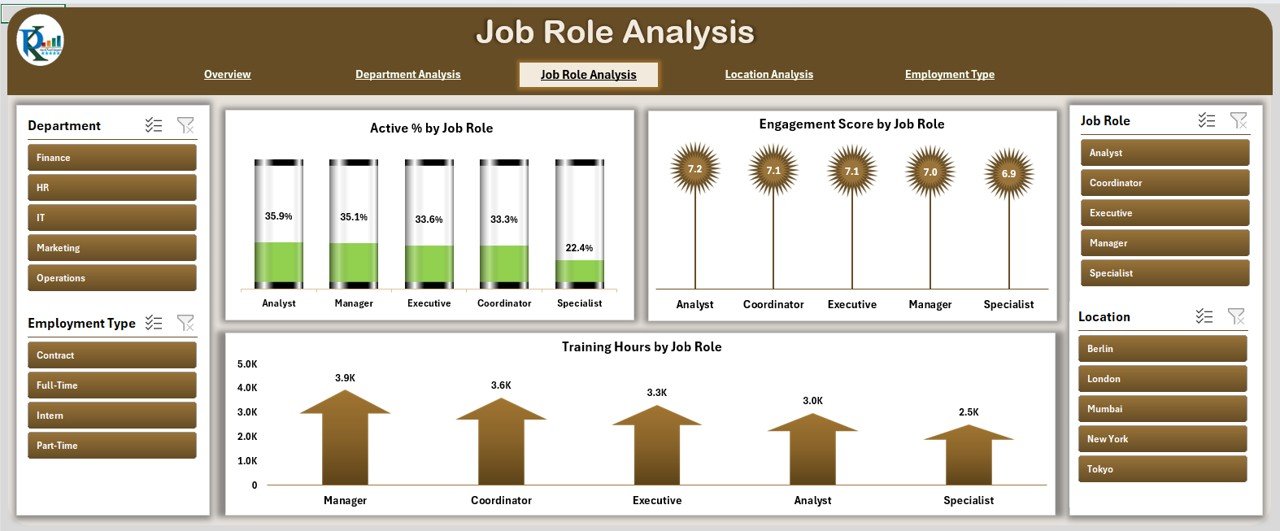
👔 Job Role Analysis
Performance and training at the job-role level — cuts across departments. Charts include Engagement Score, Active Percentage, and Training Hours by Role. Useful for talent programs where “Senior Engineers” need to be compared across all engineering teams, or where “Sales Managers” need to be benchmarked consistently regardless of which region they sit in.
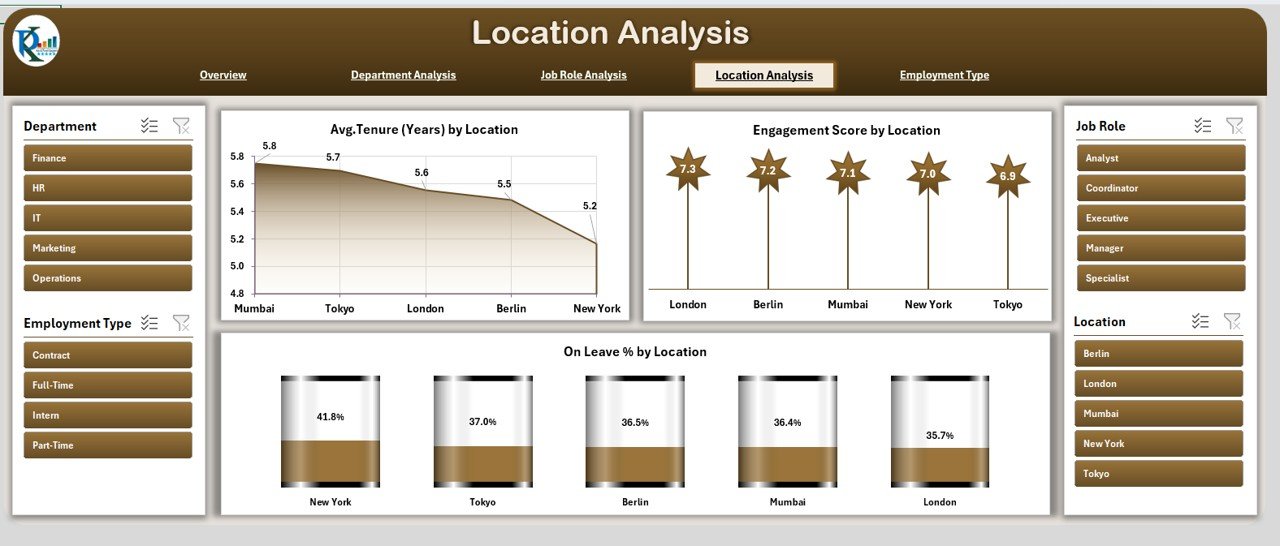
🌐 Location Analysis
Compares performance across offices, regional hubs, and remote teams. Charts include Tenure, Engagement, and Leave Percentage by Location. This is where distributed-team HR leaders spot site-specific culture issues before they escalate to executive-level retention concerns.
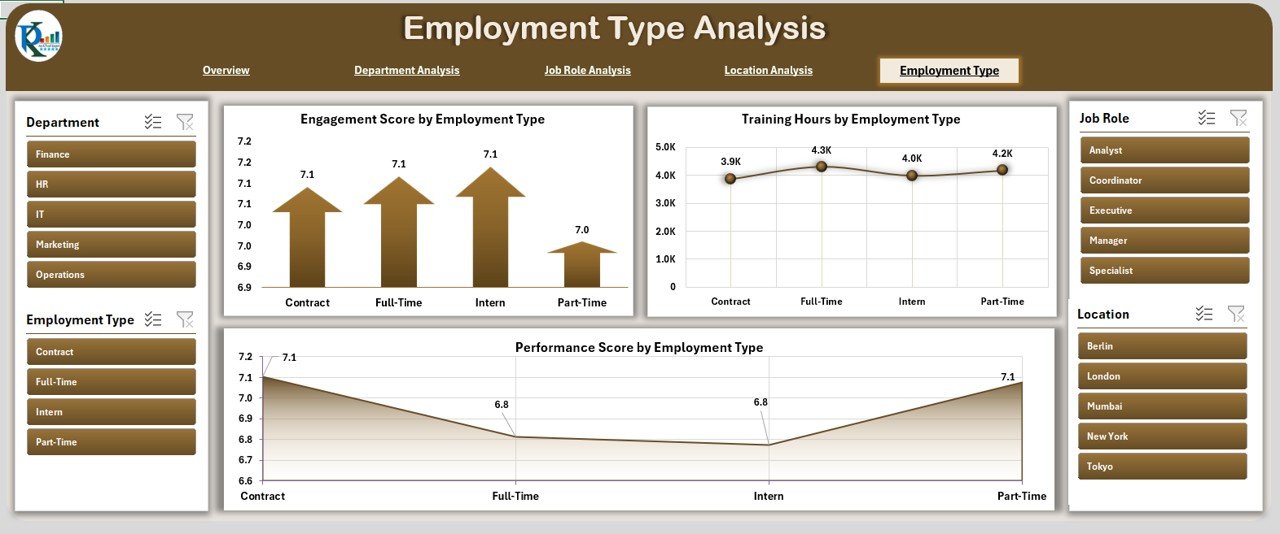
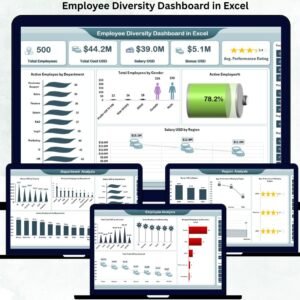
📋 Employment Type Analysis
Full-time vs. part-time vs. contract workforce analysis. Charts include Performance, Training Hours, and Engagement Score by Employment Type. Critical for modern workforces where a third or more of the team may be contract, fractional, or part-time.
🗄️ Support Sheet (Backend Data)
Stores the backend employee roster data. Every chart and KPI on every page pulls from this one sheet — update it, and the entire dashboard refreshes automatically. Perfect for a weekly or monthly refresh cycle pulling from your HRIS.
👥 Stop rebuilding the HR dashboard every month.
Get a ready-to-use 5-page HR analytics workbook covering training, performance, engagement, tenure, and leave — across departments, job roles, locations, and employment types. Paste your data, refresh, present.
Excel HR Dashboard vs. Full HRIS vs. Manual Reporting
| Feature | Our Excel HR Dashboard | Full HRIS (Workday / SAP SF / BambooHR) | Manual Spreadsheet Reporting |
|---|---|---|---|
| License Cost | One-time $17.99 | $6-$150 per employee per month | Free (bundled with MS365) |
| Implementation Time | Same day (paste data, refresh) | 2 weeks (BambooHR) to 6 months (Workday) | Rebuilt monthly from scratch |
| Employee Record Storage | ❌ Reporting only | ✅ Full HRIS with audit trail | ❌ No centralized storage |
| Payroll Processing | ❌ No | ✅ Integrated (ADP, Paylocity) or via connector | ❌ No |
| Performance / Engagement / Training Analytics | ✅ 5-page cross-dimensional analysis | ✅ Native dashboards + analytics add-ons | Pivot tables, manual rebuild |
| Self-Service Employee Portal | ❌ No | ✅ Mobile-first, time-off, pay stubs | ❌ No |
| Compliance / Audit Trail | Excel version history via OneDrive | ✅ SOC 2, ISO 27001, role-based access | ❌ No formal audit trail |
| Best For | HR teams needing fast analytics on top of existing systems, or 10-500 employee companies still spreadsheet-native | Companies wanting full system of record, payroll, and compliance | Teams under 20 employees with minimal reporting needs |
Honest positioning — this dashboard does not replace Workday, BambooHR, ADP, or any HRIS. If you need to store employee records, run payroll, manage time off, or handle benefits enrollment, you need an HRIS. What this dashboard does is sit on top of your HRIS export (or your manual spreadsheet) and produce the cross-dimensional analytics layer that HRIS native reporting typically requires a paid analytics add-on or a BI tool to deliver. For HR Directors presenting to the C-suite, this is often the fastest path to “professional-looking workforce analytics” without a Tableau or Power BI license.
Who Uses This Dashboard
| Role / Function | Primary Use Case |
|---|---|
| HR Directors & VP People | Monthly leadership presentation, board-ready workforce analytics |
| Heads of People Ops | Cross-departmental engagement, retention, and performance reviews |
| HR Business Partners | Department-level deep dives for executive business partners |
| Talent Analytics Teams | Job role, location, and employment type benchmarking |
| Learning & Development Leaders | Training hours by department and role, engagement correlation |
| Compensation & Benefits Analysts | Tenure and leave patterns by location and employment type |
| CHROs / Chief People Officers | Board-deck workforce metrics without involving BI teams |
| HR Consultants & Fractional CPOs | Standardized analytics template for multiple client engagements |
Benefits You’ll See in the First 30 Days
- 📊 Single-source workforce view — one file, five pages, every cut you need
- ⏱️ Monthly report time cut by 60-80% — typical HR analyst recovers 4-8 hours per month
- 🎯 Cross-dimensional analysis — department × location × job role, without pivot table rebuilds
- 🔄 Auto-refresh on data update — paste new roster, everything recalculates
- 📈 Executive-ready visuals — charts sized and formatted for direct paste into board decks
- 💰 Near-zero cost — $17.99 vs. $36,000+/year for HRIS analytics add-ons
- 🔓 Fully customizable — edit any chart, add KPIs, change colors to match your brand
How to Use the Dashboard (Step-by-Step)
- Download and open the .xlsx file in Microsoft Excel (Windows, Mac, or Excel Online — works on all three).
- Navigate to the Support sheet — this is where your employee roster data lives.
- Export your employee roster from your HRIS — BambooHR, ADP, Workday, HiBob, Paylocity, Paycor all export to Excel/CSV natively.
- Paste your data into the Support sheet — keep the column structure intact (Employee ID, Name, Department, Job Role, Location, Employment Type, Tenure, Performance Score, Engagement Score, Training Hours, Status).
- Click to any dashboard page — Overview, Department, Job Role, Location, or Employment Type. All KPIs and charts refresh automatically.
- Use the Page Navigator on the left to move between views during executive presentations.
- Filter and analyze — use Excel’s native filters in the Support sheet to drill into specific teams, locations, or time windows.
- Screenshot or export charts directly into your board deck, monthly review, or leadership presentation.
- Schedule a monthly refresh — export fresh HRIS data on the first business day of each month, paste into Support, and the dashboard is updated in under 5 minutes.
- Protect sensitive data — enable workbook password protection before sharing with anyone outside HR.
Optional Upgrades You Can Add Later
- HRIS Auto-Sync via Power Query — connect directly to BambooHR or Workday APIs, so the dashboard auto-refreshes without manual export/paste.
- Power BI Overlay — connect a Power BI report to the same Support sheet for enterprise-grade dashboards with row-level security.
- Forecasting Module — add headcount and turnover forecasting using Excel’s FORECAST.ETS function for the next 12 months.
- Diversity, Equity & Inclusion (DEI) Page — add a sixth analytical page tracking representation by gender, ethnicity, age band, and seniority level.
- Compensation Analytics — extend the data model to include salary bands, pay equity analysis, and comp-ratio tracking.
- Employee Net Promoter Score (eNPS) — add an eNPS calculation tab with trend tracking over time.
- Mobile-friendly export — publish to OneDrive with Excel Online sharing so managers can view from phones.
Best Practices From High-Performing HR Teams
- Refresh monthly, review quarterly. Monthly refresh keeps the data honest. Quarterly review with leadership keeps the narrative consistent. Weekly refresh is usually overkill for strategic HR metrics.
- Standardize your department, job role, and location taxonomies. The dashboard is only as good as the consistency of your master data. “Engineering” vs. “Engineering – Platform” vs. “Platform Eng” will look like three different departments on the chart.
- Weight performance scores carefully. A department of 3 senior engineers with 4.5/5 ratings should not dominate the bar chart over a department of 50 customer support agents with 4.0/5 ratings. Consider weighted averages in your source data.
- Keep DEI analytics in a separate, permission-controlled workbook. Gender, ethnicity, age band, and compensation data are subject to stricter access controls. Pull them into a separate file with tighter sharing permissions.
- Own the narrative, not just the numbers. The Overview page screenshot should come with a 3-sentence written narrative. HR leaders who land analytics presentations do 80% of the work in the narrative, not in the chart formatting.
Related Templates You May Need
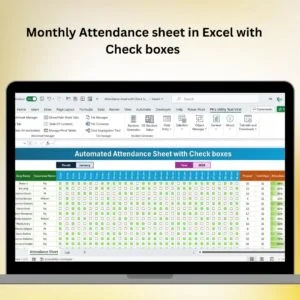
- Monthly Attendance Sheet in Excel — daily attendance tracking with overtime and leave calculation
- Attendance Management System Lite — Excel-VBA attendance system with leave management
- Incident Report Tracker in Excel — OSHA-compliant workplace safety and incident tracking
- Task Management Tracker in Google Sheets — team and project task coordination
- Payroll Calculator & Payslip Generator — Excel-based payroll and payslip generation
- All HR & Payroll Templates — complete catalog
- All Excel & Power BI Dashboards
Frequently Asked Questions
Can this replace Workday, BambooHR, ADP, or SAP SuccessFactors?
No — this is an analytics layer, not an HRIS. It does not store employee records as your system of record, process payroll, handle benefits enrollment, manage time-off requests, or run compliance workflows. What it does is turn your HRIS-exported data (or your manual roster spreadsheet) into a 5-page analytical dashboard at roughly 0.05% of the cost of adding a paid analytics module to your HRIS. For HR teams priced out of Workday’s $400K-$1.3M first-year cost for a 1,000-employee company, or for SMBs that haven’t yet adopted an HRIS, this is the fastest path to workforce visibility.
What employee data fields does the dashboard need?
The Support sheet expects these fields: Employee ID, Name, Department, Job Role, Location, Employment Type (full-time / part-time / contract), Tenure (in months or years), Performance Score, Engagement Score, Training Hours, and Status (Active / On Leave / Terminated). Every major HRIS exports these fields natively — BambooHR, Workday, SAP SuccessFactors, ADP Workforce Now, HiBob, Paylocity, Paycor, Rippling, Gusto, and Zoho People all support these columns in their standard CSV/Excel exports.
How many employees can the dashboard handle?
Tested comfortably up to 5,000 employees in the Support sheet. Beyond that, Excel’s calculation performance starts to degrade on typical laptops. For 5,000-20,000 employees, consider moving to a Power BI or Tableau version connected to the same data structure. For 20,000+, you’re at the point where Workday or SAP SuccessFactors analytics modules are justified.
Does it work on Mac or just Windows Excel?
Works on both — the dashboard uses Excel-native features (charts, pivot tables, formulas) rather than VBA, so compatibility is broad. Microsoft Excel for Mac (2019 or later), Microsoft 365 Mac, Excel for Windows (2016 or later), and Excel Online all render the dashboard correctly.
Can I integrate with my HRIS for auto-refresh?
The base template uses manual paste-refresh, but you can layer Power Query on top to pull directly from BambooHR’s API, Workday’s Report-as-a-Service, or any HRIS that supports an OData or REST endpoint. A mid-level Excel/Power Query consultant typically builds this integration in 4-8 hours.
Is the data secure?
The file itself is a standard .xlsx, so security depends entirely on where you store it. For SOC 2-level controls, store in a SharePoint or OneDrive for Business location with conditional access policies, audit logging, and DLP rules. For smaller teams, password-protect the workbook and store in a restricted-access folder. For DEI and compensation data specifically, use a separate workbook with tighter permissions.
Can I customize the charts, colors, or KPIs?
Yes — everything is unlocked. Every chart can be re-formatted, re-colored, or replaced. Every KPI can be changed to a different metric. Every page layout can be modified. Most HR teams customize the color scheme to match their corporate brand within the first hour.
What if my engagement scores are in a separate survey tool like Culture Amp or Lattice?
Export the scores from your engagement survey tool (Culture Amp, Lattice, 15Five, Leapsome, Officevibe all export to Excel/CSV), then VLOOKUP or XLOOKUP them into the Support sheet by Employee ID. This is a 5-10 minute setup per refresh cycle, and the resulting dashboard gives you engagement × performance × tenure cross-analysis that most survey tools don’t offer natively.
Is this GDPR-compliant?
The dashboard is a tool — GDPR compliance depends on your data handling practices. For EU employee data: minimize what’s in the Support sheet (avoid national ID numbers, health data, detailed compensation), apply access controls, maintain a data processing log, and delete the file according to your retention policy. The dashboard’s lack of persistent cloud storage actually makes certain GDPR controls simpler than a full HRIS.
When should I actually upgrade to a real HRIS analytics module?
Signals it’s time to graduate: (1) you’ve crossed 500 employees and weekly data refresh has become a full-time job, (2) compliance (SOX, GDPR, CCPA) requires a full audit trail you can’t maintain in Excel, (3) your HR team needs role-based access where managers see only their direct reports, (4) you’re integrating performance, compensation, and succession planning in a single workflow, or (5) your finance team has asked for real-time headcount data for budget planning. At that point, start evaluating Workday Analytics, BambooHR Advantage, or Visier — typically 6-12 months before you need to go live.
Read the Full Blog Post on PK: An Excel Expert
For a detailed walkthrough of each page, chart construction tips, and real-world HR use cases from mid-market HR Directors already using this template, read the full guide on our Excel expertise blog: HR Dashboard in Excel — Full Guide.
Watch the Walkthrough Video
See the dashboard in action — Overview page, Department deep-dive, Job Role analysis, Location comparison, and Employment Type breakdown:
🎥 Subscribe to YouTube.com/@PKAnExcelExpert for weekly Excel dashboard walkthroughs for HR, Finance, Operations, and Sales leaders.
Ready to replace your monthly HR rebuild with a 5-minute refresh?
Download the HR Dashboard in Excel — one-time $17.99, 5-page analytical workbook covering training, performance, engagement, tenure, and leave across every HR dimension.


Reviews
There are no reviews yet.