In the fast-moving world of manufacturing, precision and speed are everything. 📊 Managing production, quality, downtime, and efficiency manually can feel like juggling fire—time-consuming, error-prone, and inefficient. That’s where the Manufacturing KPI Dashboard in Excel shines — your all-in-one, interactive, and ready-to-use performance tracker built for today’s industrial leaders.
This Excel-based dashboard transforms raw factory data into meaningful visuals, helping you monitor performance, identify gaps, and make smarter, faster decisions. 🚀
⚙️ Key Features of the Manufacturing KPI Dashboard in Excel
✅ All-in-One Dashboard: Track KPIs like production efficiency, cost, downtime, and quality in one place.
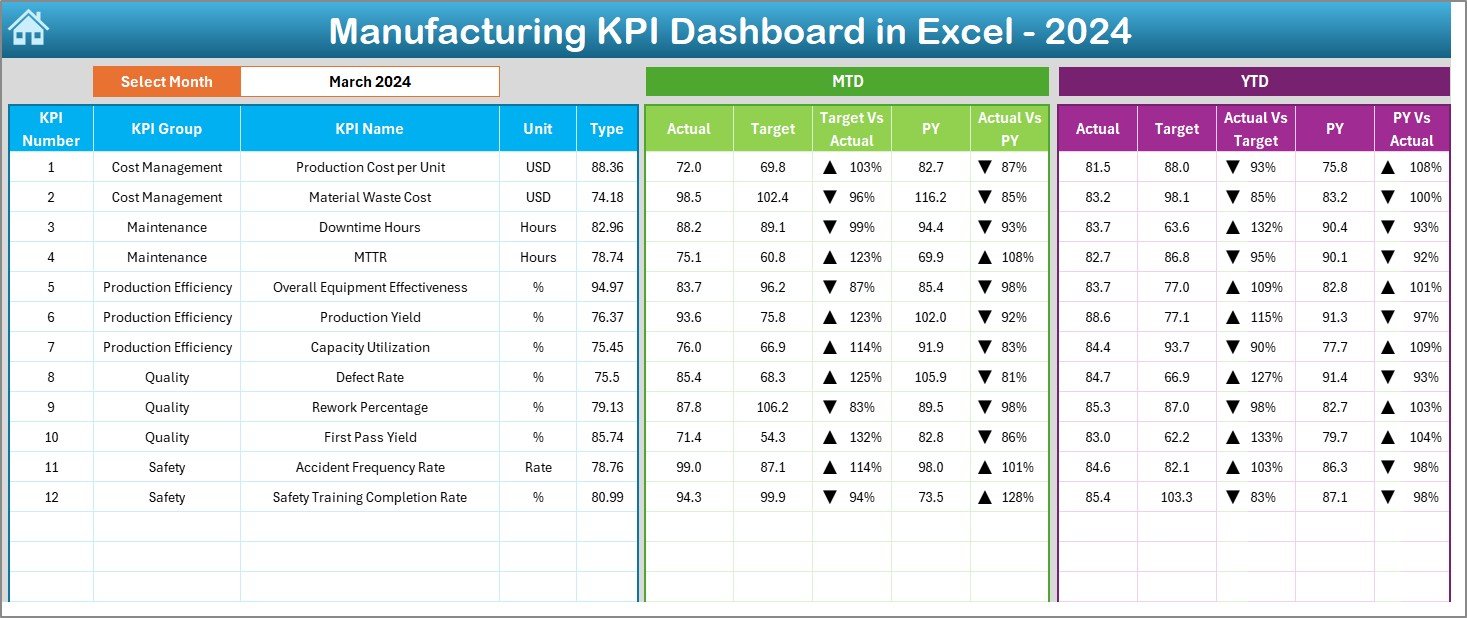
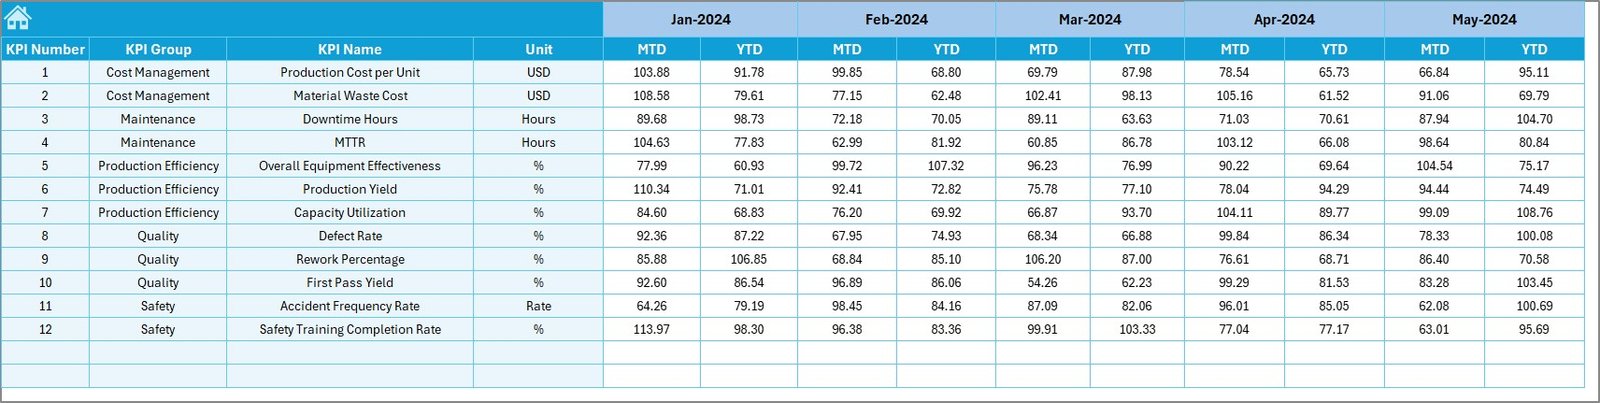
📈 Real-Time Data Updates: Instantly view Month-to-Date (MTD) and Year-to-Date (YTD) numbers for all KPIs.
🎯 Dynamic Target Comparison: See Actual vs Target and Actual vs Previous Year results with automated arrows showing performance trends.
🧭 Smart Navigation: Easily switch between sheets using built-in navigation buttons—no endless scrolling!
🧩 Conditional Formatting: Green arrows = improvement, Red arrows = decline — making analysis effortless.
📊 Customizable Structure: Add, remove, or edit KPIs anytime to match your organization’s unique goals.
💰 Cost-Effective Solution: Get Power BI-like insights in Excel — no extra tools or coding required.
🔐 Secured and Protected Sheets: Prevent accidental edits and maintain accuracy across departments.
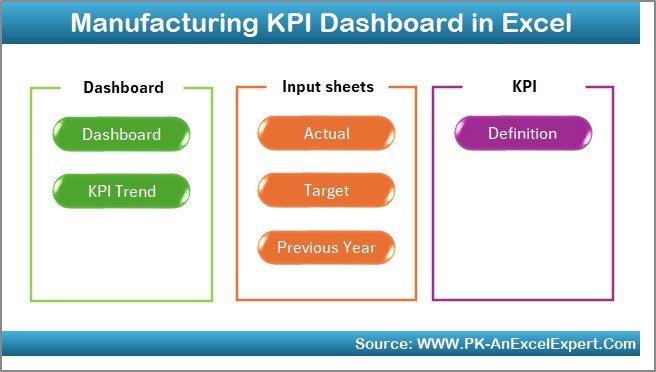
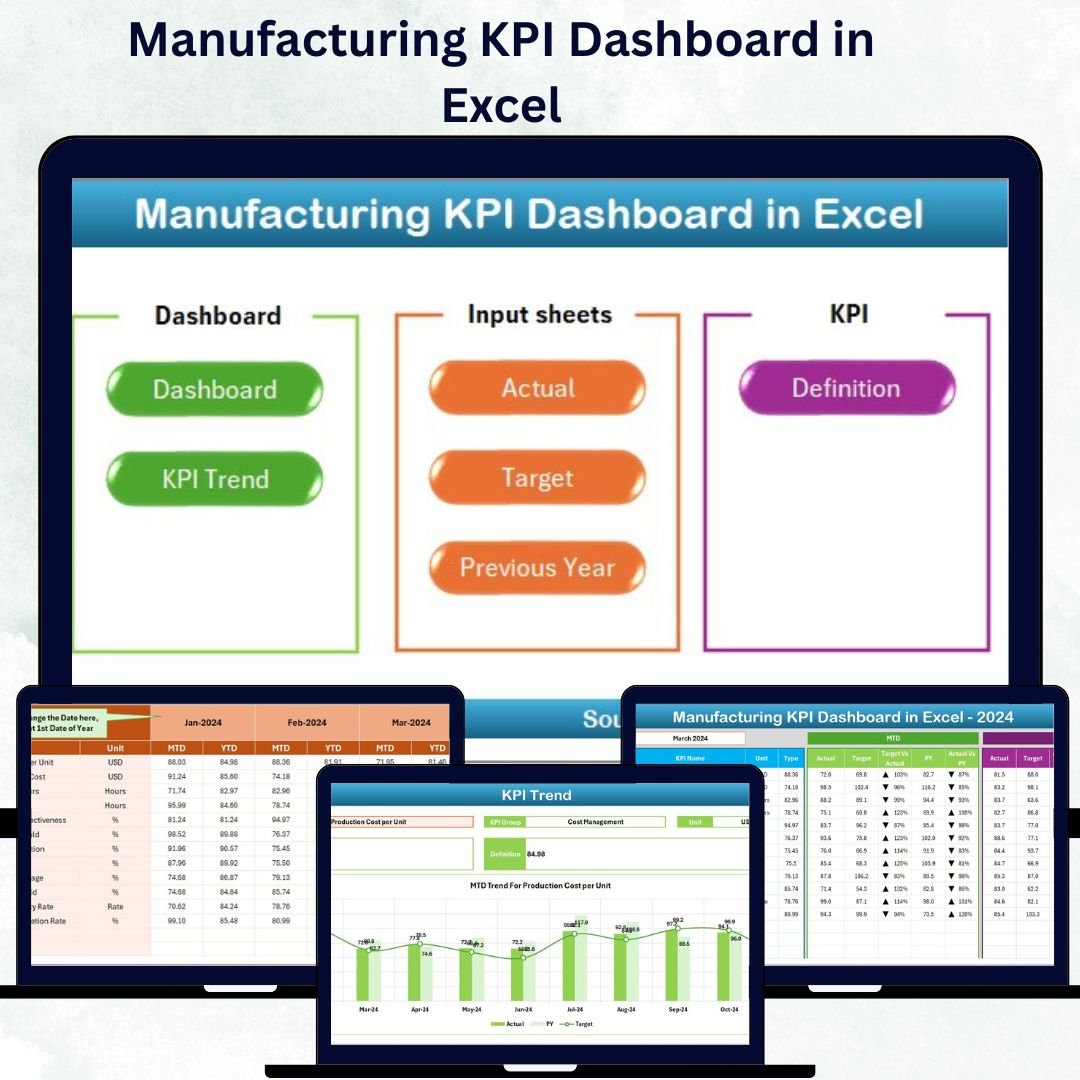
📂 What’s Inside the Manufacturing KPI Dashboard in Excel
This template includes seven powerful worksheet tabs, each designed for a specific function:
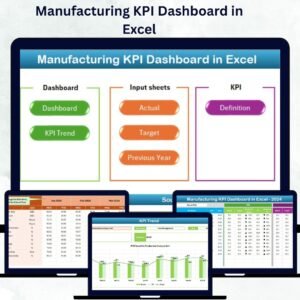
1️⃣ Home Sheet: The command center with six clickable buttons to jump between dashboards and data sheets.
2️⃣ Dashboard Sheet: The main performance page that displays all MTD and YTD metrics dynamically based on month selection.
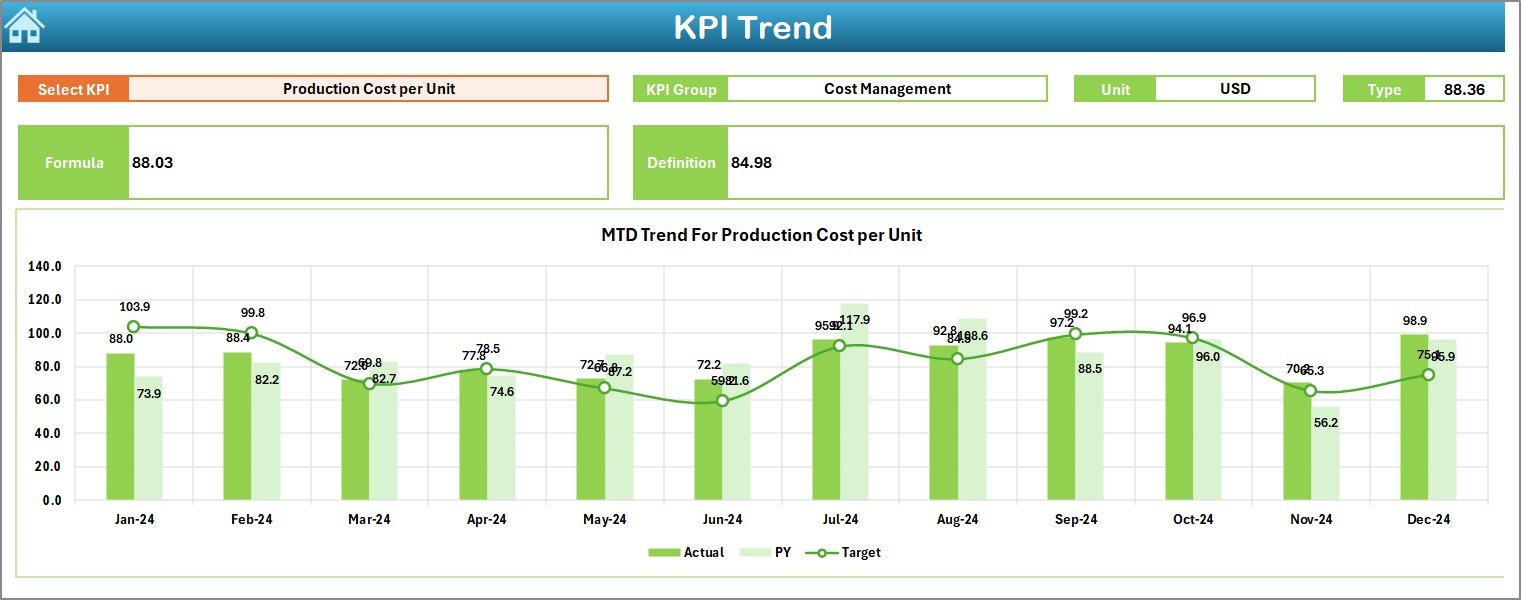
3️⃣ KPI Trend Sheet: A deep-dive tool that lets you analyze the performance trend of any KPI over time with interactive charts.
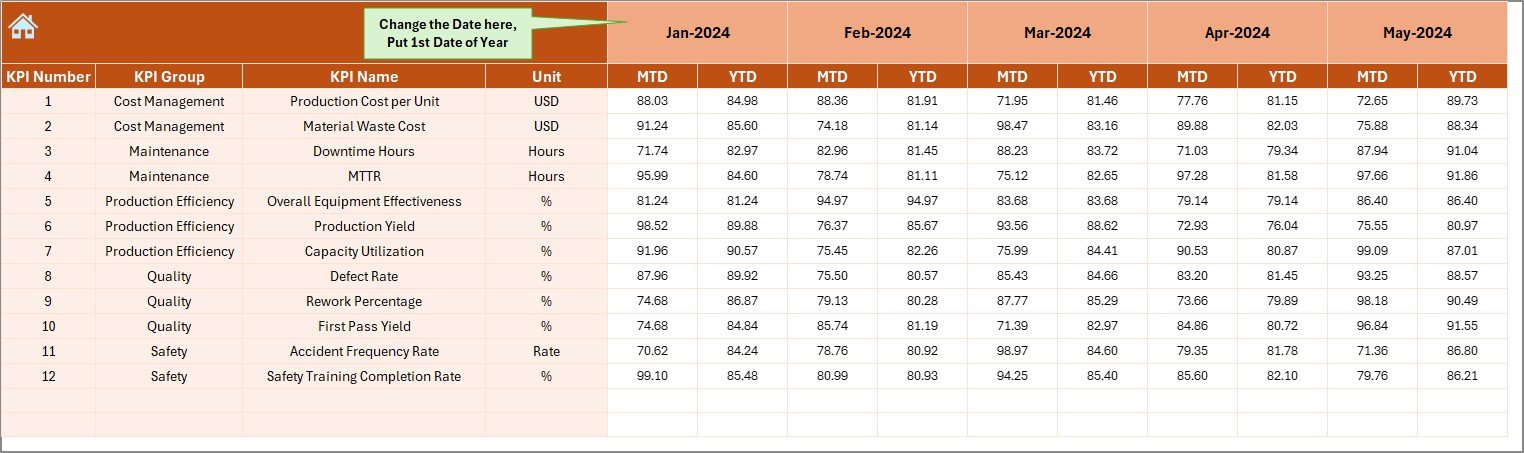
4️⃣ Actual Numbers Input Sheet: Input real monthly data here — the dashboard updates automatically.
5️⃣ Target Sheet: Define your monthly and yearly goals to compare progress.
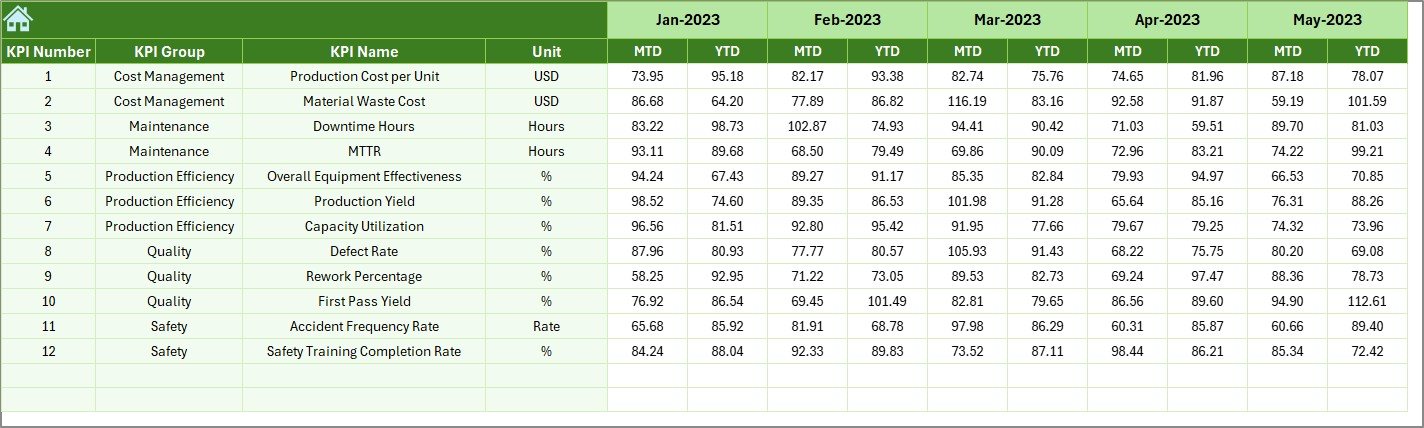
6️⃣ Previous Year Numbers Sheet: Benchmark your current results against historical performance.
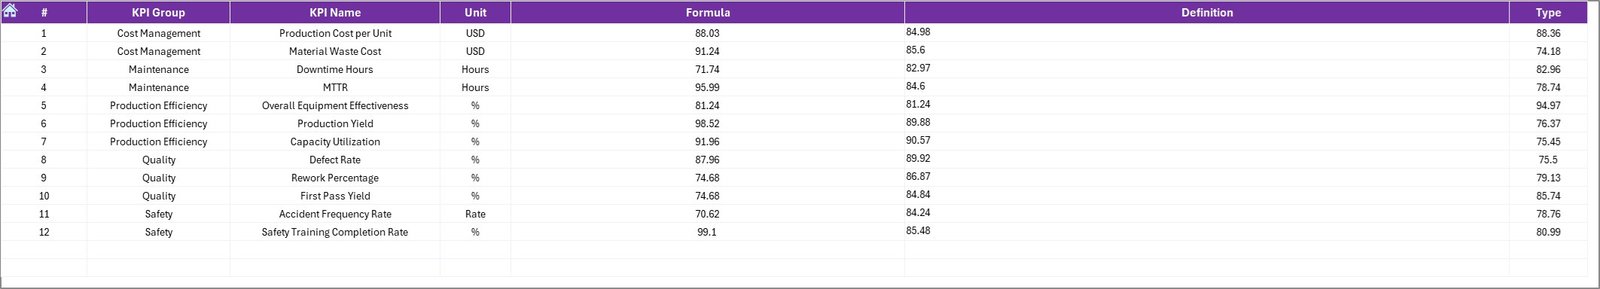
7️⃣ KPI Definition Sheet: A detailed list of each KPI’s group, formula, unit, and whether it’s LTB (Lower the Better) or UTB (Upper the Better).
Each sheet is linked seamlessly, ensuring a smooth flow from data entry to decision-making.
🧠 How to Use the Manufacturing KPI Dashboard in Excel
1️⃣ Enter Your Data: Input Actual, Target, and Previous Year values in their respective sheets.
2️⃣ Select the Month: Choose the desired month from the dropdown (cell D3) to refresh dashboard visuals.
3️⃣ Review Visuals: Check the green/red arrow indicators for quick performance insights.
4️⃣ Analyze Trends: Go to the KPI Trend Sheet to study month-over-month improvements or issues.
5️⃣ Take Action: Use insights to optimize processes, reduce downtime, and enhance productivity.
No technical skills required — just plug in your data and let Excel do the heavy lifting! 💪
👥 Who Can Benefit from This Manufacturing KPI Dashboard
🏭 Production Managers: Gain instant visibility into production efficiency, downtime, and quality metrics.
💼 Operations Directors: Track strategic goals and identify areas for cost optimization.
📊 Quality Analysts: Monitor defect rates and maintain consistent output standards.
⚙️ Maintenance Teams: Analyze machine downtime and plan preventive maintenance effectively.
📈 Executives and Stakeholders: View summarized KPIs for strategic decision-making.
🧑💻 Data Analysts: Use as a foundation for advanced Power BI or ERP integrations.
Whether you’re a small workshop or a large-scale factory, this Excel template provides a clear, actionable view of your entire manufacturing process.


Reviews
There are no reviews yet.