

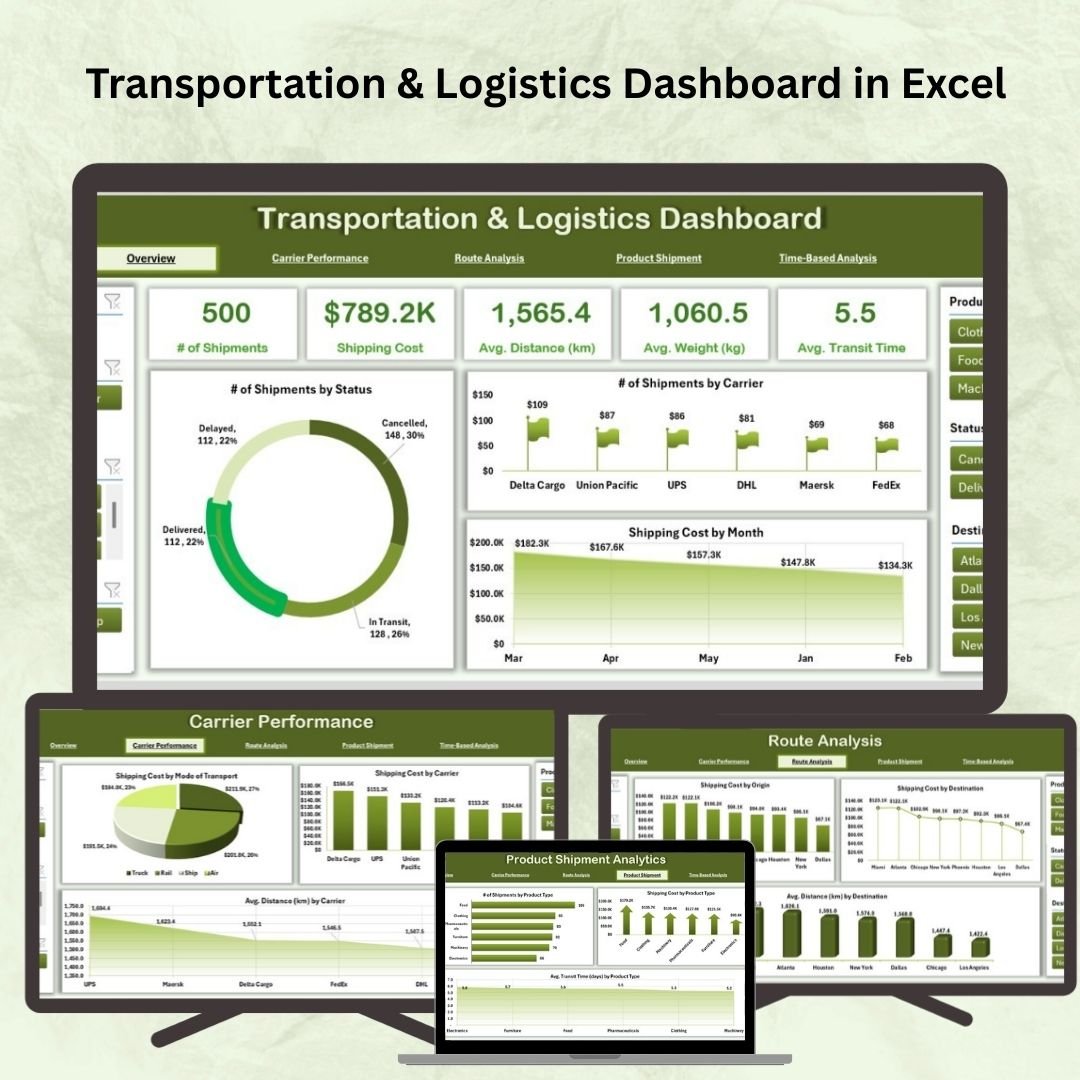

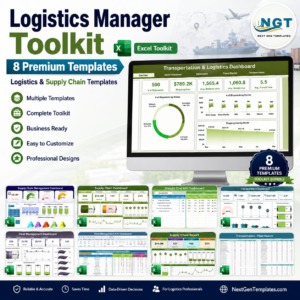
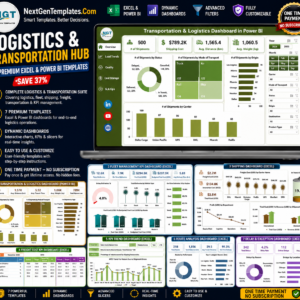
The Transportation & Logistics Dashboard in Excel is a shipment reporting template with five analysis views: Overview, Carrier Performance, Route Analysis, Product Shipment Analytics and Time-Based Analysis. Enter shipment records, refresh the PivotTables, and use slicers to compare transport costs, delivery performance and shipment patterns.
Built entirely using PivotTables, slicers, and charts, this ready-to-use Excel tool helps logistics managers, supply chain professionals, and analysts monitor KPIs and drive smarter decisions—without expensive software or technical complexity.
✨ Key Features of the Transportation & Logistics Dashboard
🏠 Overview Page – The Big Picture
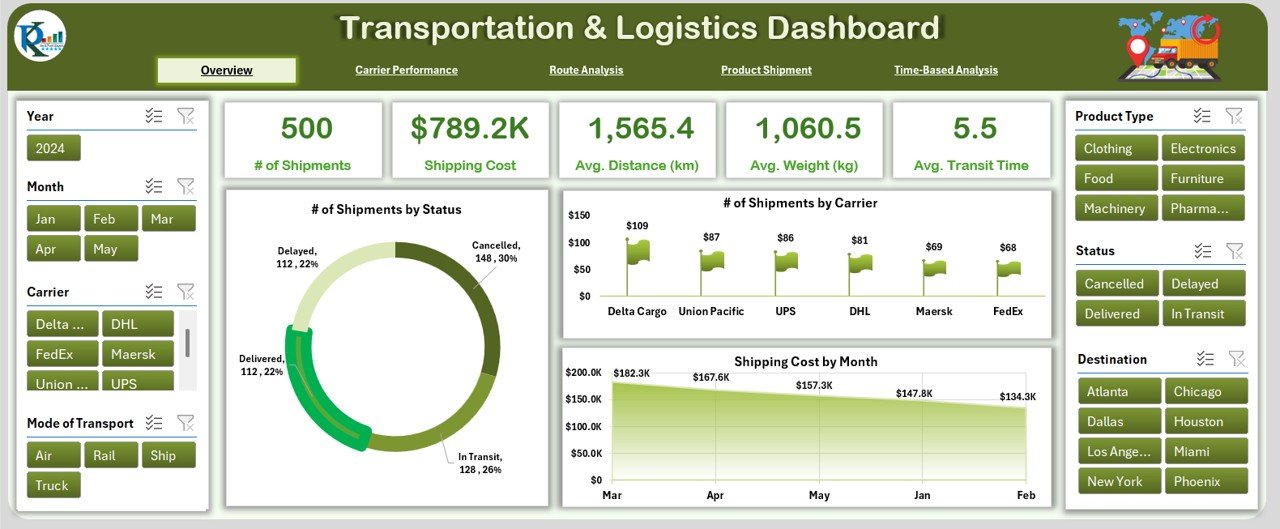
Gain a snapshot of your operations with:
📅 Slicers for filtering by Month, Carrier, Route, and Product Type
🧾 5 KPI Cards including Total Shipments, Cost, On-Time %, and more
📊 Charts:
Shipments by Status
Shipments by Carrier
Cost by Month
Perfect for executive reporting and operations reviews.
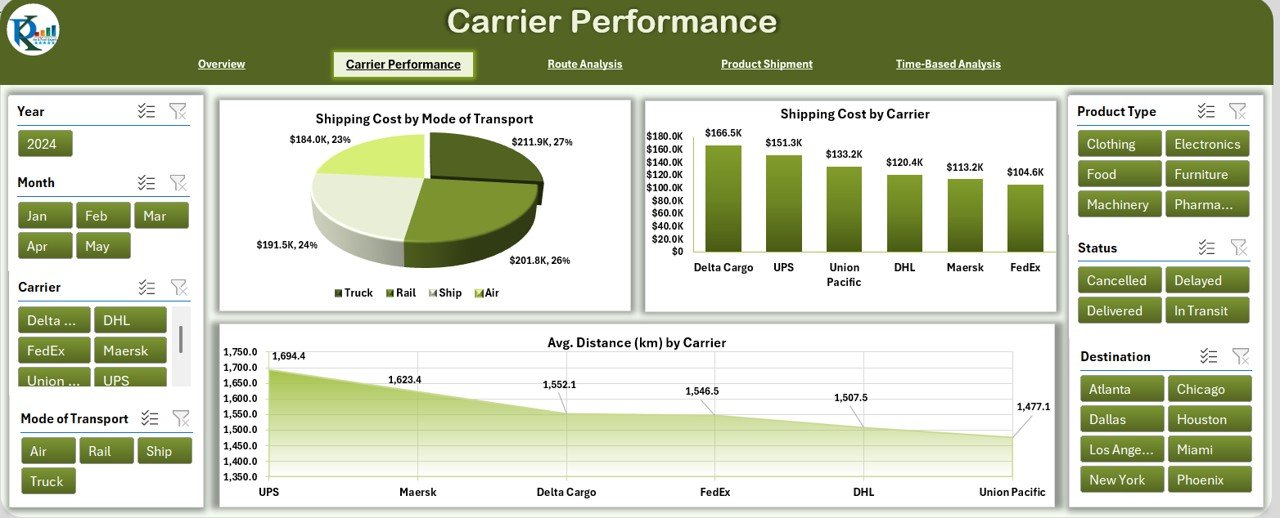
🚛 Carrier Performance Page
Compare performance across delivery partners:
Slicers for filtering
KPIs like Avg. Delivery Time, Cost Efficiency
Charts:
Cost by Carrier
Cost by Transport Mode
Avg. Distance by Carrier
Ideal for contract negotiations and evaluating vendor efficiency.
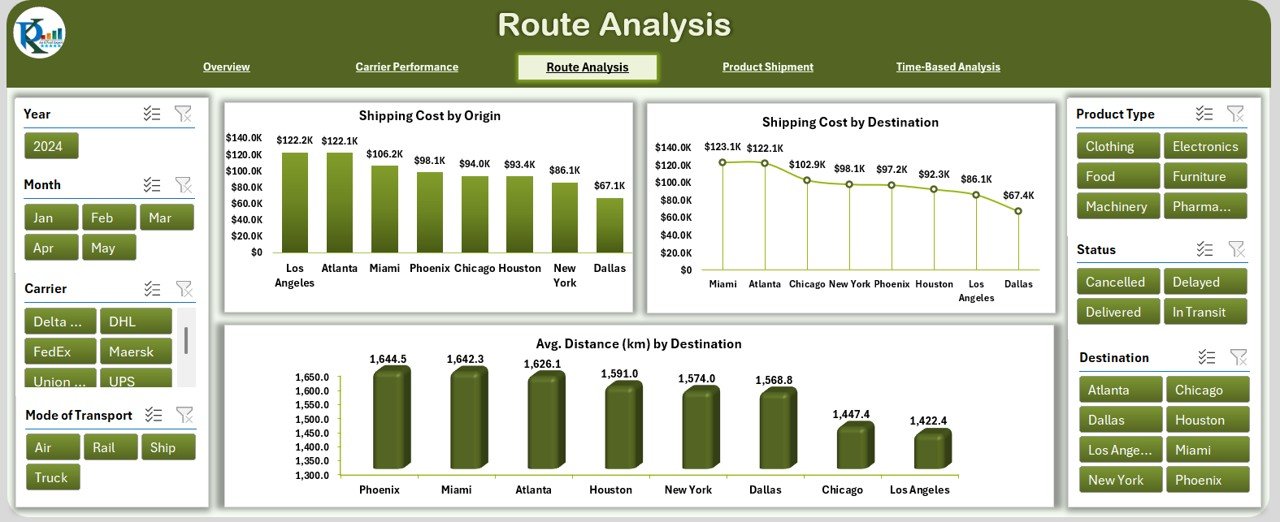
🗺️ Route Analysis Page
Pinpoint which routes are efficient—and which need improvement:
Filters for Origin, Destination, Date
Charts:
Cost by Origin/Destination
Avg. Distance by Route
Great for route planning and optimization.
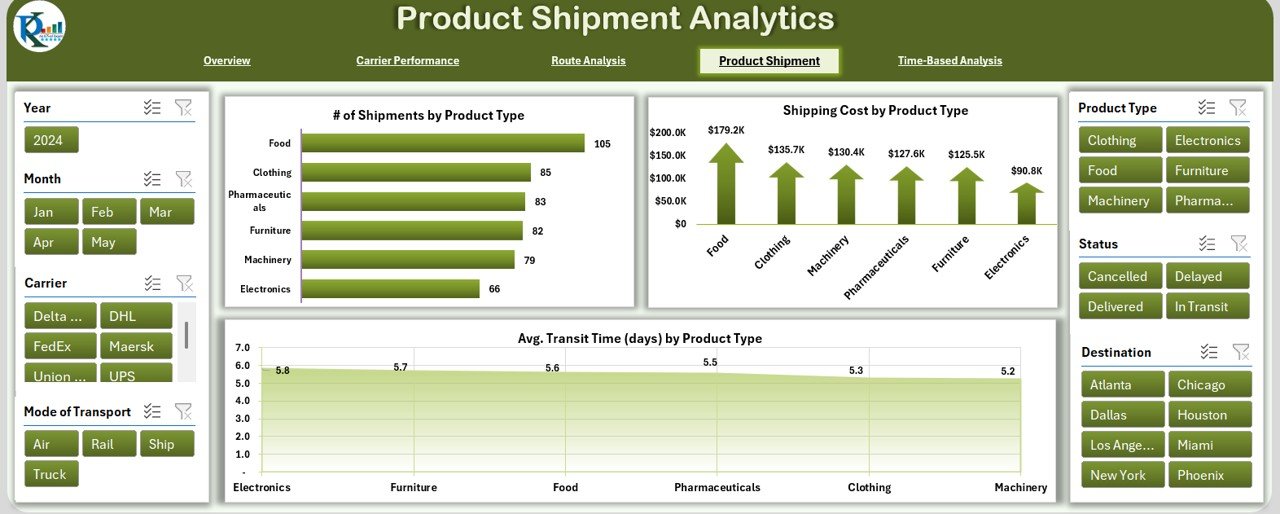
📦 Product Shipment Analytics Page
Understand how different products impact logistics:
Filters for Product Type
KPIs: Avg. Weight, Transit Time, Shipment Count
Charts:
Transit Time by Product Type
Cost by Product Category
Useful for inventory and supply chain managers.
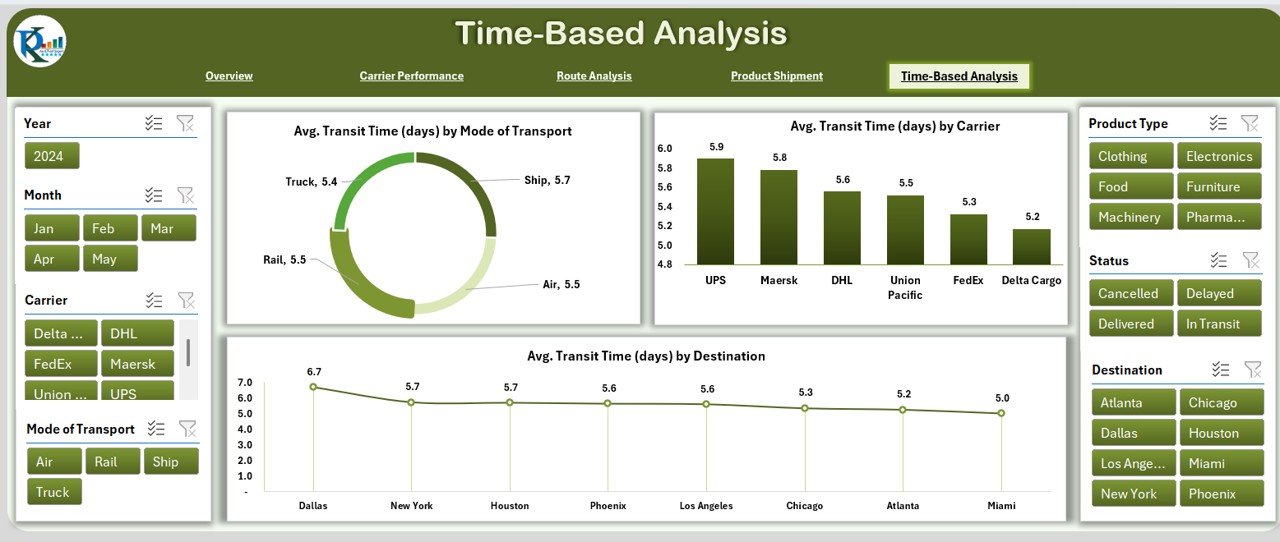
📈 Time-Based Analysis Page
Track trends over time:
Time slicers (Month, Quarter, Year)
Charts:
Avg. Transit Time by Mode, Carrier, and Destination
Best for identifying seasonal patterns and delivery delays.
📦 What’s Inside the Excel Dashboard?
5 Analytical Sheets – Overview, Carrier, Route, Product, and Time-based Analysis
PivotTables & Slicers – For dynamic filtering
Visual KPI Cards – Summary metrics at a glance
Charts – Line, bar, and pie charts built on real-time data
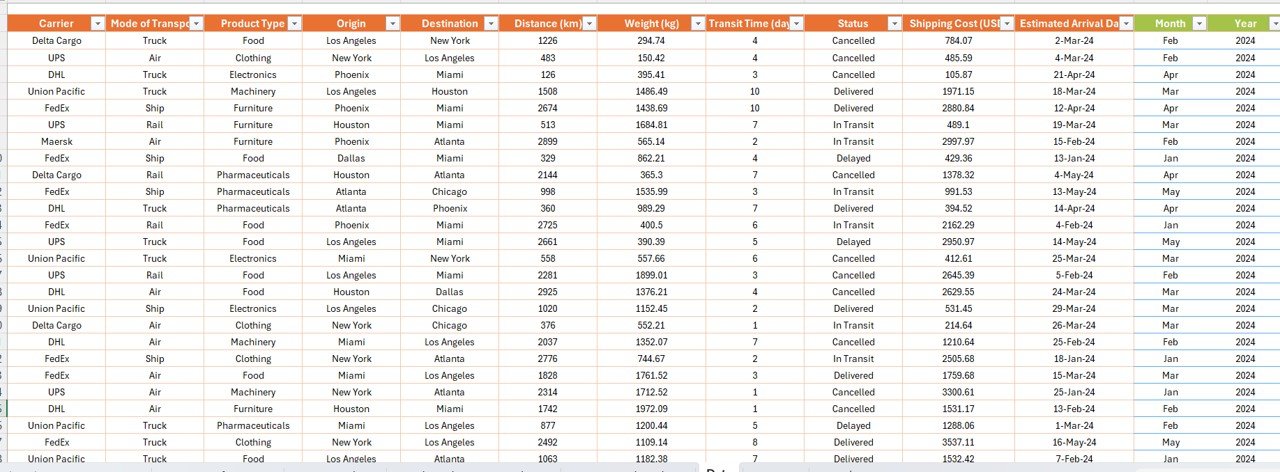
Structured Data Input – With fields like Date, Carrier, Product, Cost, Distance, and Status
No Coding Needed – Beginner-friendly and customizable
🛠 How to Use the Dashboard
Enter Your Shipment Data
Use the structured Excel table with fields like Date, Shipment ID, Carrier, Cost, etc.Refresh PivotTables
Hit “Refresh All” to update visuals and KPIs.Use Filters and Slicers
Drill down into specific carriers, products, or time periods.Analyze Charts & KPIs
Evaluate trends, cost breakdowns, and delivery times.Make Informed Decisions
Use insights for carrier negotiations, route changes, and performance improvements.
👥 Who Should Use This Dashboard?
✅ Logistics Managers – Monitor end-to-end performance and delivery metrics
✅ Supply Chain Analysts – Evaluate trends, route efficiency, and cost savings
✅ Warehouse & Distribution Teams – Track inbound/outbound movements
✅ Operations Managers – Align logistics strategy with business goals
✅ eCommerce & Retail Companies – Manage product-level and location-based delivery insights
Whether you’re a small business or large enterprise, this dashboard can adapt to your needs.
📘 Click here to read the Detailed blog post
🎥 Visit our YouTube channel to learn step-by-step video tutorials
Questions About Logistics Reporting
How do I update the dashboard?
Enter shipment records in the structured data table, then use Refresh All to update the PivotTables and visuals. Use the slicers to focus on carriers, routes, products or dates.
What data does the dashboard use?
The input fields include shipment date, shipment ID, carrier, product, cost, distance and status. Keep these fields consistent when adding new records so the charts remain useful.
For related templates and reporting options, explore our supply chain and logistics reporting guide.















Reviews
There are no reviews yet.